EWW the
Mexican ETF
With the
Trump factor and normally how the stock market over reacts to events I thought
now would be a good time to do some analysis on the EWW the Mexican exchange
traded fund (ETF) and see what evidence we can put together to see if it’s a buying
opportunity.
Market sees
more risk, I see less risk…
As per norm
we will go through it systematically to look for opportunities.
When we
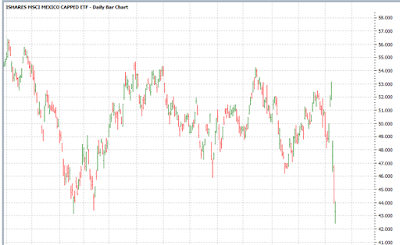
look at the stock chart we can see that EWW is currently at its 52 week low. In
all time perspective from the lowest low to the highest high $41 it is currently
sitting just above the 50% draw-down mark (The stock is currently very close to
this 50% mark). This does not mean too much but just perspective on where the
stock has come from.
52 week low
chart
Historical
chart perspective
When we
look at the up day down day count we can see that over the history of the EWW
stock the all-time historical average is 1.01 this means it basically goes up
as much as it goes down. The Mexican ETF does not have much of an upward drift.
To reference it the SPY (American Market has a historical average of 1.13 which
obviously shows an upward drift over time). The 365 day average for EWW is
0.95, this means it is currently below its average and over the last 365 days
it has had more down days then up days.
Over time we can expect this to revert
to its average of 1.01. This cannot happen in one sweep, but will take time.
The takeaway
is that currently the EWW (Mexican) ETF needs to have more up days then down
days to get back to its norm.
The next
step is the pain index. This means how much draw-down (pain) can we expect EWW
to take on based on historical data. The pain index shows that EWW has a draw-down
pain of about 15%, with the Max draw down of 64%. The current Draw-down is 39%
meaning we are currently double the original pain index. This means that using
the all-time high we know that the historical max draw-down based on historical
data would be $27. This is good to know where the stock has been and its
average pain. We are currently double the pain value so that should be telling
you something.
If we look
at the last 365 days the current draw-down is 24%, with a 98.71% probability of
rising. Over the last 17 years of data, only 57 occurrences out of 4424 occurrences
showed a pullback of more than 24%.
When we
look at the current pull back EWW is experiencing we can note that based on the
current share price where it is, and historical data, if we sold an put option at
$41 there is a 60% probability of NOT being exercised with December expiration.
This is
different than the Volatility Option value but both are closely related. Using
historical data looks at every day in history whereas option valuing is based
on the share price as it currently stands and not where it has been. This is
just based on IV and current share price. The option is a faster way of
calculating the future risks, but in my opinion is limited.
EWW current
Option Implied Volatility value
Looking at
option Volatility we can see that the option volatility, that is the IV Rank,
is close to 100%. We can clearly see from the chart (blue line) that the IV is
at the higher part of the range then the previous year. This means that the
options value has increased as the market sees that the risk for EWW has
increased.
Using a High option IV means we can make greater profits with the
same amount of capital if we traded options. Using 30 delta options we can
expect about a price of about $1.14 per option contract with the expiry in December
and strike price of $41. The return on capital is about 11% for the 1 month.
Take away.
Option volatility is at highs making option premium rich. The current Draw-down
of the stock is 2 times the pain index of the stock. The stock up day down day
count is below average meaning the stock needs more up days then down days in
the future to get back to norm. And lastly the $41 option is another 5% fall
from where the current share price is.
Yes Trump can do all sorts of things, but they are all unknowns. What we do know is the data provided here, the probabilities and statistics.
Yes Trump can do all sorts of things, but they are all unknowns. What we do know is the data provided here, the probabilities and statistics.
This by no
means is a recommendation and an investor should trade small.
I am not a licensed Investment Adviser and DO NOT provide financial Advice. Everything contained on Face book, twitter and linked
websites, has been written for the purpose of providing investment techniques. The
material neither purports to be, nor is it intended to be, advise to trade or
to invest in any financial instrument. I Expressly disclaim all and any
liability to any person, with respect of anything, and of the consequence of
anything, done or omitted to be done by any such person in reliance upon the
whole or any part of the material.


